Loading...
> docs/monitoring
Instance Monitoring and Health
5 min read
Instances
Last updated April 05, 2026
Overview
Every ClawHosters instance includes built-in health monitoring. The instance dashboard shows the current status of your instance, resource usage, and container health. This page explains how health checks work, what the status indicators mean, and what to do when something goes wrong.
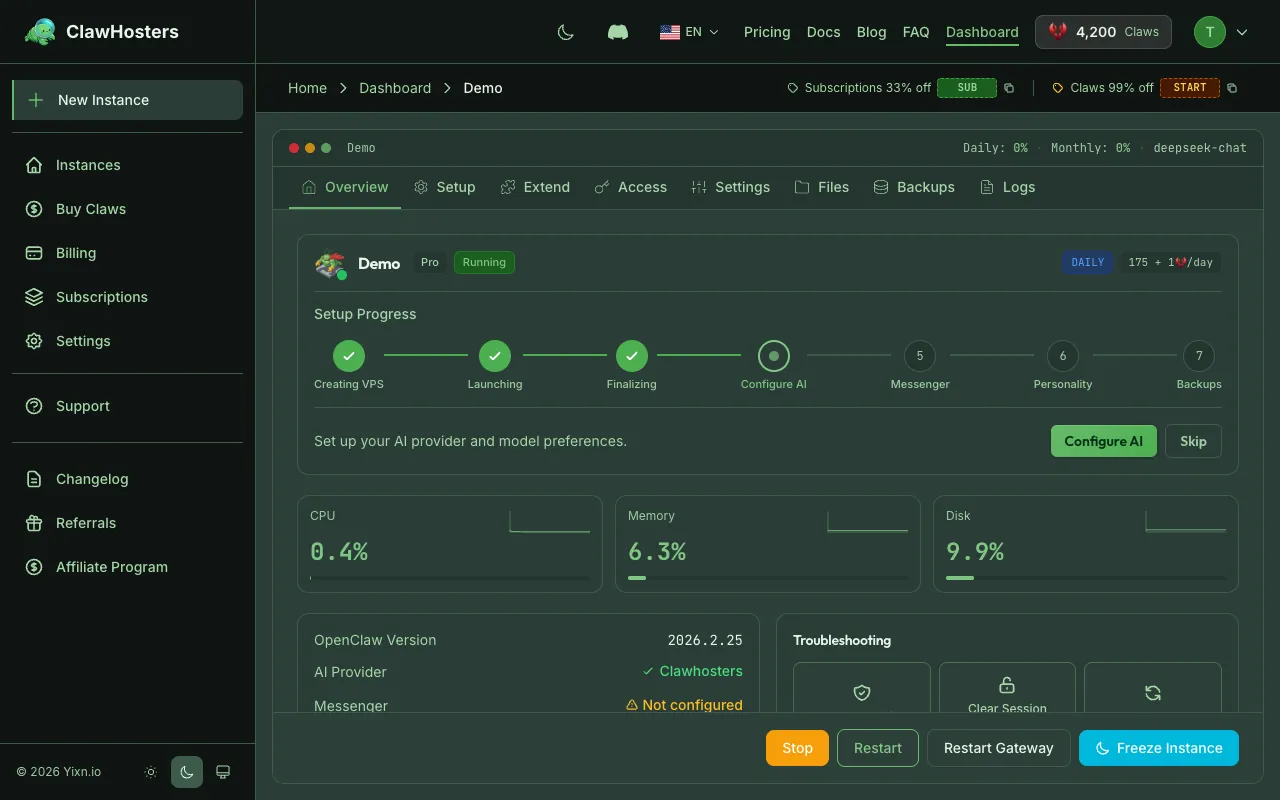
Instance Status
The instance dashboard displays the current status of your instance with a color-coded indicator:
| Status | Indicator | Meaning |
|---|---|---|
| Running | Green | Instance is healthy and operational |
| Stopped | Gray | Instance is powered off (billing continues, VPS stays allocated) |
| Deploying | Yellow | Instance is being set up or restarted |
| Provisioning | Yellow | VPS is being created |
| Pending Configuration | Yellow | Server is ready but no LLM API key configured yet |
| Deploy Failed | Red | Deployment did not complete successfully |
| Paused | Orange | Stopped due to insufficient Claws balance |
| Upgrading | Yellow | Tier upgrade in progress |
| Frozen | Blue | Instance is frozen at a reduced billing rate (15 Claws/day) |
| Updating | Yellow | A system update is in progress |
| Restoring | Yellow | A backup restore is in progress |
| Backing Up | Yellow | A backup is being created |
| Error | Red | An unexpected error occurred with the instance |
A running instance with a green indicator means the container is up and responding to health checks.
Docker Health Checks
Each instance runs inside a Docker container with an automatic health check configured:
| Parameter | Value |
|---|---|
| Interval | Every 30 seconds |
| Timeout | 10 seconds per check |
| Retries | 3 consecutive failures before unhealthy |
| Start period | 60 seconds (grace period after startup) |
Docker marks the container as healthy when the check command succeeds, or unhealthy after 3 consecutive failures. The 60-second start period gives the OpenClaw gateway time to initialize before health checks begin.
Resource Usage
The instance dashboard displays resource usage for your VPS:
| Metric | What It Shows |
|---|---|
| CPU | Current CPU utilization as a percentage |
| Memory | Current RAM usage as a percentage |
| Disk | Storage usage as a percentage |
These metrics update periodically. If any metric consistently reaches high levels, your workload may benefit from a higher tier.
Resource Limits by Tier
| Tier | CPU Cores | RAM | Storage |
|---|---|---|---|
| Budget | 2 vCPU | 4 GB | 40 GB |
| Balanced | 4 vCPU | 8 GB | 80 GB |
| Pro | 8 vCPU | 16 GB | 160 GB |
Checking Health via SSH
If you have SSH access enabled, you can inspect your instance directly:
bash
# Check if the container is running
docker ps

# View container health status
docker inspect --format='{{.State.Health.Status}}' openclaw-<instance_id>

# View recent health check results
docker inspect --format='{{json .State.Health}}' openclaw-<instance_id> | python3 -m json.tool

# Check resource usage
docker stats --no-stream

# Check disk space on the VPS
df -h

# Check memory usage
free -h
Replace <instance_id> with your instance ID shown in the dashboard.
Common Health Issues
Container Restart Loops
The container keeps stopping and restarting. Possible causes:
- The OpenClaw process crashes on startup due to a configuration issue
- Insufficient memory causes an OOM kill, and Docker restarts the container
Check the container logs for error messages:
bash
docker logs openclaw-<instance_id> --tail 50
Out-of-Memory (OOM) Kills
Docker terminates the container when it exceeds its memory limit. Signs of OOM:
- Container restarts unexpectedly
docker inspectshowsOOMKilled: true
If this happens frequently, consider upgrading to a higher tier with more memory.
Disk Full
When the VPS runs out of disk space, the container may fail to write logs or data. Check with:
bash
df -h
If disk usage is near capacity, check for large log files or accumulated data. Docker log rotation is configured (50 MB max, 3 files), but application data inside the container can still grow.
Health Check Failures
The health check tests the OpenClaw gateway inside the container. If this fails:
- The OpenClaw gateway may still be starting (wait 60 seconds after a restart)
- The gateway process may have crashed (check container logs)
- Port binding issues inside the container
What to Do When Your Instance is Unhealthy
Step 1: Check the Dashboard
Open your instance dashboard. The status indicator and any error messages give the first clue.
Step 2: Restart the Instance
Most transient issues are resolved by restarting:
- Go to the Instance Dashboard
- Click Stop
- Wait a few seconds
- Click Start
The instance reboots and the container starts fresh.
Step 3: Rebuild the Instance
If restarting does not help, rebuild the instance from the dashboard. This creates a fresh container with your existing configuration. Custom modifications made via SSH will be lost.
Step 4: Check Logs (SSH)
If you have SSH access, inspect the container logs:
bash
docker logs openclaw-<instance_id> --tail 100
Look for error messages, stack traces, or repeated crash patterns.
Step 5: Contact Support
If the issue persists and you cannot identify the cause, contact support through the ClawHosters dashboard. Include:
- Your instance ID
- The status shown in the dashboard
- When the issue started
- Any recent changes you made
Support is available for all instances. Instances with SSH access are marked as Limited Support, meaning we may decline requests for issues caused by manual server modifications.
Related Documentation
- Instance Overview. Instance statuses, lifecycle, and tiers
- Instance Settings and Configuration. LLM, messaging, and web access settings
- Starting and Stopping Instances. Power management and billing impact
- SSH Access to Your Instance. Direct server access for advanced users
- Troubleshooting Common Issues. Solutions for frequent problems
Related Documentation
Docker Configuration
How Docker Is Used Every ClawHosters instance runs OpenClaw inside a Docker container on a dedic...
Understanding Resource Limits
How Resources Are Allocated Each ClawHosters instance runs on a dedicated Hetzner Cloud VPS. The...
Instance Overview
What Is an Instance? An instance is a dedicated OpenClaw server running on ClawHosters. It is yo...